The briefing report is your overall summary of the situation confronting you - good or bad - at the start of every turn.
Use this information to understand your relative strengths and weaknesses, to better plan how you build and deploy your ships, aircraft and troops.
The situation report gives you static information - a text summary - compiled by the Head of your Naval Intelligence Department.
For a dynamic view of actions and events in the previous turn, use your turn replay function. This will help you understand how you got to where you are now!
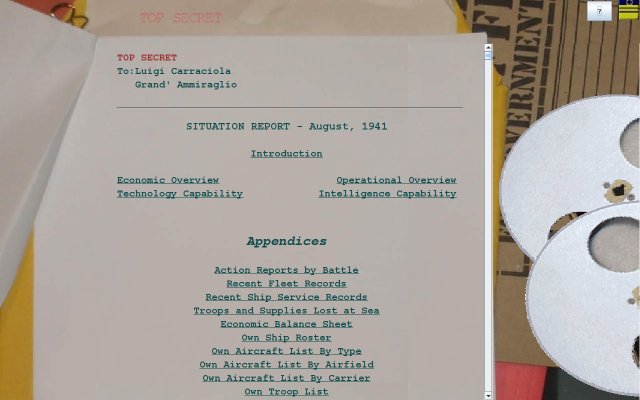
From your Admiral's Office, click on 'Briefings' on the main blackboard menu.
You will now see this screen:
The news reels at the right of the screen are your entry point to the turn replay screen. Here, we are interested in learning about the Situation Report.
The report lies open at the first page. It is dated to the current turn, and has a table of contents. The entries in the table of contents are hyperlinked to the relevant sections of the report. Use the hyperlinks to jump forward, or just scroll through the report using the right hand scroll bar.
Throughout the report, there are many links to other sections within the report, to assist with navigation.
The report has these main sections:
It also has a number of major appendices:
Here, the odds facing you at the start of the war are briefly summarised.
The growth (or reduction) in the size of your economy – as measured by Resource Points – is shown, both since the start of the War and since the last turn.
The value of any convoy shipments last turn is shown, as well as the total value of infrastructure investments.
In January of every year after the first, the Report also compares your situation with what is known of the enemy’s economy.
Details of your economic balance sheet - the gains and losses in resource points in the last turn and the current balance - are available in an Appendix to the Report. The Appendix is hyperlinked for easy access.
The losses last turn in naval and merchant shipping are summarised, and estimated enemy losses are quoted.
A hyperlink is provided to the appendix that details all battles in the last turn.
There are also hyperlinks to appendices detailing your own and the enemy's current ships.
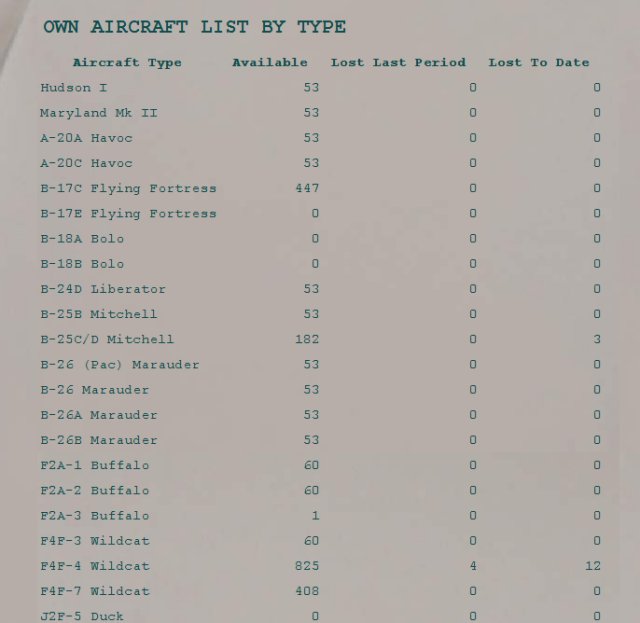
Aircraft losses last turn and to date are summarised and a link is provided to the appendix listing all your current aircraft by type.
Any troop casualties from the last turn are summarised and links are provided to any land battle reports as well as to the appendix detailing current troop strengths.
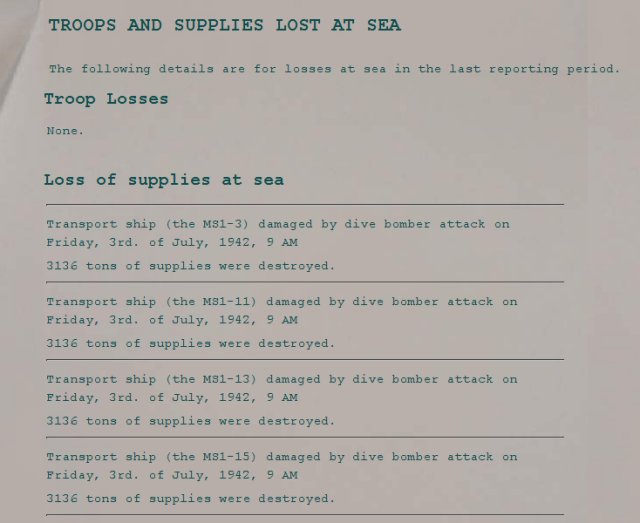
If supplies were lost at sea from transport ships being sunk or damaged, this will be summarised here and there will be a link to the appendix that details these losses.
Your current position relative to the enemy's estimated strengths is summarised, and shown graphically. Your levels are shown in blue. The enemy’s estimated technology levels are shown in orange.
An example is shown below:
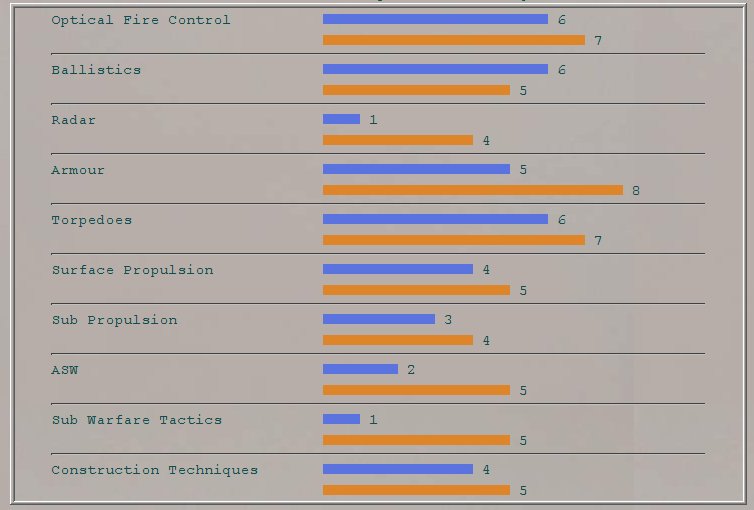
A brief note summarises the state of development of your intelligence compared to the assessed enemy strength. (Note - this assessment may not be accurate. As with all of your intelligence assessments they are likely to be more innacurate the weaker your level of intelligence and the stronger the enemy's.
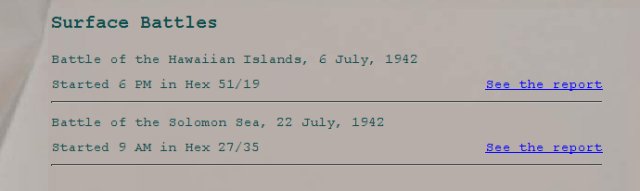
This is the first appendix. It provides links to all battles that occurred last period. The battles may be between surface ships, or air strikes on ships or land targets, or submarine attacks, or surface ship or aerial bombardment of land targets, or amphibious assaults. Damage from mines is also summarised. An example is shown below:

Following the links leads to lists of each battle by category. Alongside each battle is a link to the actual Battle Summary:
See battle summary for information on the battle summary screen. The battle summary screen further links to a screen where surface battles can be replayed shell-by-shell!
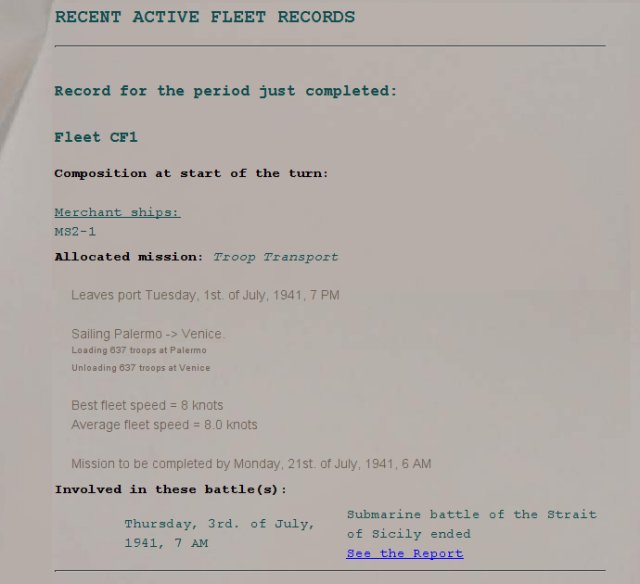
Version 1.1 has introduced a new feature: fleet records. From turn 2 onwards, reports for each fleet of major actions in the previous turn are outlined here, as well as summaries of the kind of mission the fleet was on (if the mission was a 2IC generated one). The report includes handy hyperlinks to all battles each fleet was in during the last turn. The following example shows Italian fleet CF1 - its initial composition, convoy mission orders, and reference to (and a link to) a submarine encounter:
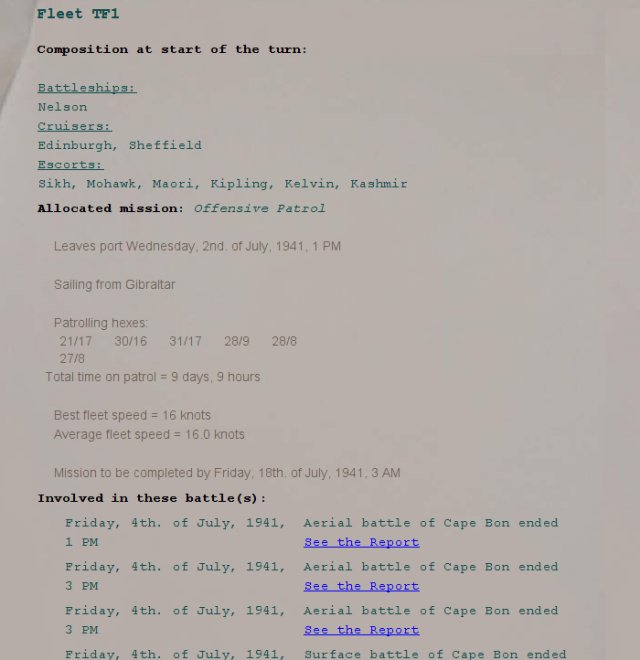
This next example shows, for the British, what happened to their fleet TF1 - it was involved in no less than four aerial attacks and a surface battle:
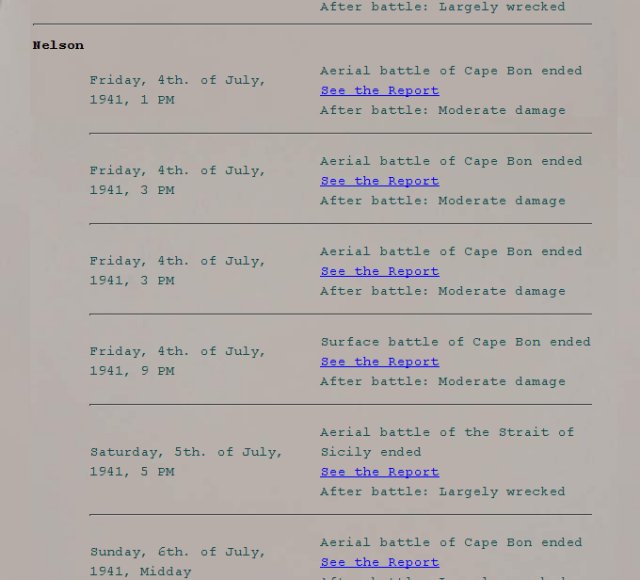
Version 1.1 has also introduced service records for your ships for the last turn. From turn 2 onwards, reports for each ship of major actions in the previous turn are outlined here. The report summarises the status of each ship after each battle, and has hyperlinks to all the battles. The following example shows the battleship Nelson's involvement in a series of battles in the last turn:
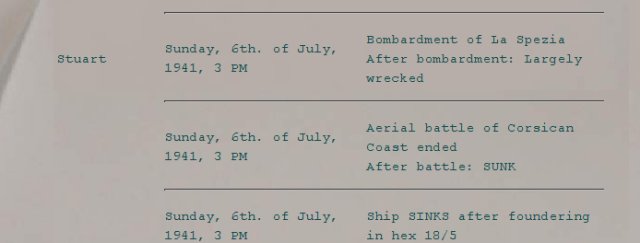
Version 1.1 has also introduced full service records for your ships. From turn 3 onwards, reports for each ship of major actions in all turns prior to the last turn are outlined here. The report summarises the status of each ship after each battle, exactly as for the recent ship records; but there are no hyperlinks to the battles. The following example shows the Destroyer Stuart's fate in July 1941. Note that the reports include after-action events - the Stuart foundered some-time after it's last battle:
This appendix gives a ship-by-ship listing of troop and/or supply losses due to the ship's being damaged or sunk.
This very important Appendix shows where all the Resource points have been spent or gained, including expenditure on new ship construction, repairs, refuelling and rearming, aircraft production, lost points from bombardment damage, points gained from industrial production and convoy shipments, as well as points transferred between ports in supply operations. Liabilities in terms of outstanding repairs to ships and port infrastructure are accounted for. The number of Resource Points currently available at your ports are shown.
An example is shown below:
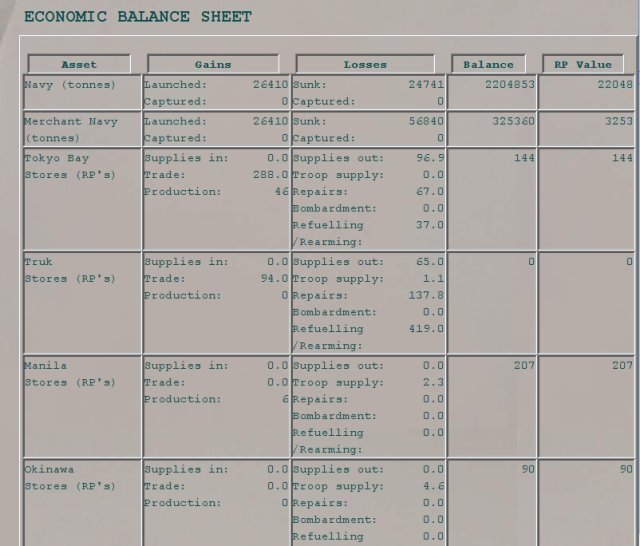
The top section of the report is organised as a table, with 5 columns and a number of rows. This is where information is given about your primary assets.
The most important information is given in the right-most column. Here, you can see the current RP value of:
The columns to the left show the gains and losses in the previous turn that resulted in the current totals.
On the first turn, the current RP values will be those you start the game with. The RPs at each port are set when a campaign is created. The naval and merchant tonnage is whatever has been built in the first turn out of the home port RPs you start with.
For example, suppose you are the British player in a Mediterranean scenario, starting with 3000 RPs at home port (Gibraltar), and 300 at Alexandria. The 3000RPs can be used to construct up to 300,000 tonnes of shipping. If you constructed say 150,000 tonnes of navy and another 100,000 tonnes of merchant ships, you would have used 2500RPs, and would have 500RPs left at Gibraltar, plus the 300 still at Alexandria. The Balance Sheet would show you having these tonnages of shipping, and with 500RPs at Gibraltar and 300RPs at Alexandria.
On subsequent turns, your current RP levels will be whatever you started the previous turn with, PLUS the gains noted in the 'Gains' column, and MINUS the losses shown in the 'Losses' column.
There are various kinds of gains and losses, as explained below.
Gains in naval or merchant shipping are produced whenever new ships are launched, as well as when enemy ships are captured. Each 100 tonnes of shipping equates to one RP.
Gains in RPs at each port can occur from various sources:
Losses in naval or merchant shipping are produced whenever your ships are sunk or captured by the enemy. Each 100 tonnes of shipping equates to one RP.
Losses in RPs at each port can occur from various sources:
In addition to your main assets, which are described above, you have aircraft, infrastructure and troops.
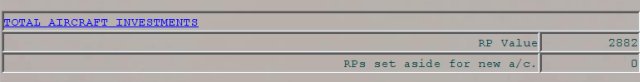
The Balance Sheet appendix next shows the total RP value of all the aircraft you currently have. (The RP value is the number of RPs spent to date in producing them).
Also shown are the number of RPs that are currently set aside for aircraft production in the current turn. These RPs have been set aside automatically. In the build aircraft phase of a turn, you use these RPs to actually order aircraft, which then become available for use in the same turn. Refer to how to build aircraft for more information.
Once you have completed the build aircraft phase, the Briefing Report will show zero for "RPs set aside for new a/c"; and the RPs used to build the aircraft will have been aded to the total RP value of the aircraft you now have.
Note that the 'TOTAL AIRCRAFT' heading for this section of the report is underlined. It is a hyperlink to a listing in the report of all your current aircraft - by type and number.
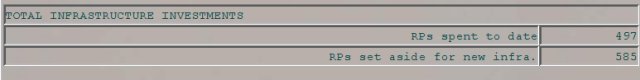
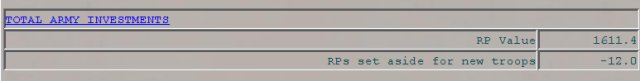
The RPs you have spent on infrastructure during a game are also considered assets. The next section of the Balance Sheet is titled 'Infrastructure Investments' and shows both the number of RPs you have spent in the game to date, and the number you intend to spend.
You spend RPs on infrastructure in the build infrastructure phase. Refer to how to build infrastructure for an explanation of the types of infrastructure you can build, and how you can allocate your expenditure.
The Balance Sheet appendix shows the total RP value of all the troops you currently have. (The RP value is the number of RPs spent to date in producing them).
Also shown are the number of RPs that are currently set aside for raising and training more troops in the current turn. These RPs have been set aside automatically. In the build troops phase of a turn, you commit this expenditure. Refer to how to build troops for more information.

The report now totals all your assets, as described above, to produce a value for your total assets.
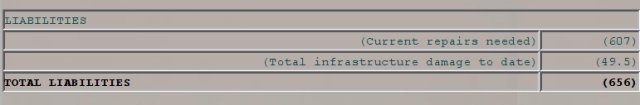
Unfortunately, no balance sheet is complete without accounting also for your liabilities! In SAS, there are two kinds of liabilities that need to be tracked:
These two liabilities are totalled in the 'Total Liabilities' value shown in the Report.
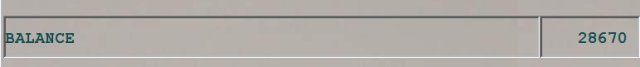
Finally, the Report shows your net worth in RPs - your total assets less your total liabilities - as the 'BALANCE' value at the end of the Balance Sheet Appendix.
Note! The balance figure is much more than an academic value. It is the main figure that counts when your performance against the enemy is assessed every year by your political masters. To be considered a strong performer, you need to show strong relative growth in your net economic position - as measured by this balance figure - compared to the enemy. See Overview - Winning and Losing for more information.
The Ship Roster lists all your ships. Scroll down or up as you need.
The screen has tick boxes allowing you to filter the list to exclude or include ships that are damaged, sunk or still building.
An example is shown below:
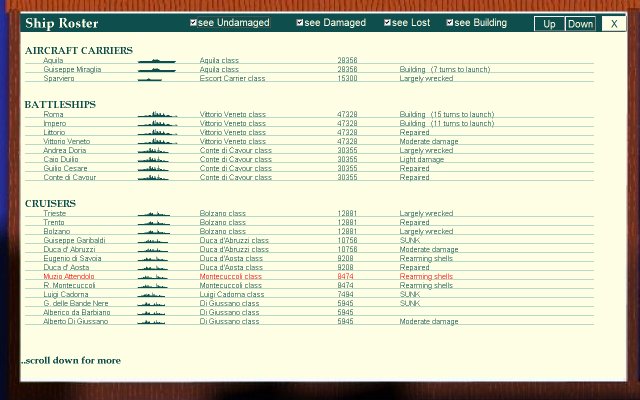
Close the Ship Roster by clicking on the 'X' button at the top-right of the screen. This returns you to the Briefing Report.
This appendix list all your current aircraft by type, showing for each type the number currently available, and the numbers lost last turn and in total since the start of the game:
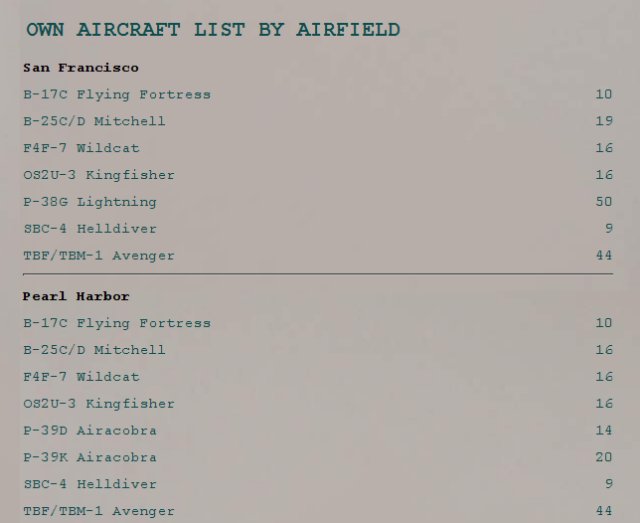
This appendix list all your currently available aircraft by type and airfield:
This appendix details all your current troop units, including their forecast supply situation over the current turn. An example is shown below:
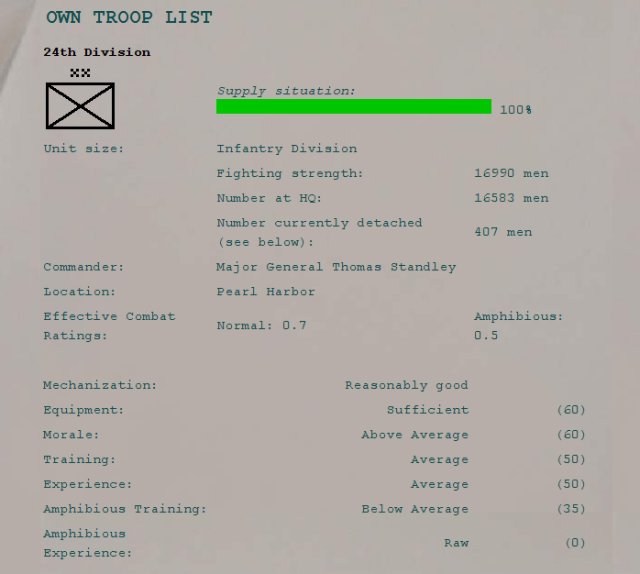
See the notes on combat value and other troop characteristics for more help on the meaning of the troop unit statistics.
This appendix is very detailed - it gives full information on the infrastructure at each of your ports:
An example is shown below:
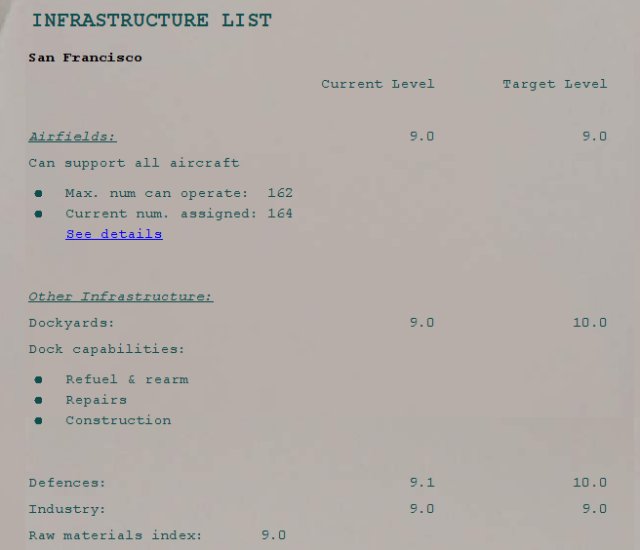
Note that very similar information is also available in the pop-up displays from on the theatre map when you elect to see the popups and then pass your mouse over any of your ports.
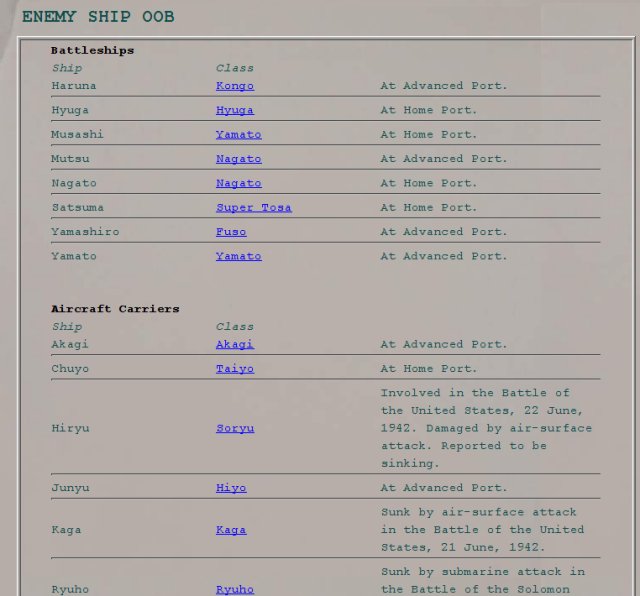
This section lists all known enemy ships, grouped into ship type categories. The status and location information is as last reported. Each ship has a hyperlink to details of the ship class design (in the next appendix).
An example is shown below:
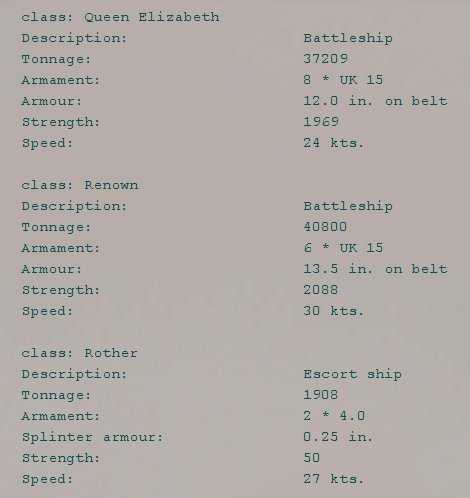
This appendix shows a summary of the design details for each enemy ship class. Remember – this information may be inaccurate in certain respects. The information is obtained from enemy ship sightings and general intelligence gathering. It will become more accurate as your naval intelligence level increases and also as you obtain more sightings of ships of the class.
An example is shown below: